| Primalgreed.com - DHI my housing Dilemma Part 2 |
| Monday, January 29, 2007 |
PLEASE REMEMBER THIS IS FOR EDUCATIONAL PURPOSES ONLY!
Continued from Part 1
Greetings all,
From the previous post, using ProfitSource, I first came across DHI on 1/12/07. The company’s profile is listed here: http://finance.yahoo.com/q/pr?s=DHI

When we last left, I was confirming the retracement levels using both the retracement tool and the wave extension tool. I hope you have tried out both, they have different advantages and disadvantages. I also like to look at several other indicators to get a better feel of “The Picture” we talked about before. From the screen shot, you can see I have included Bollinger Bands, DMI, RSI, and MACD.
First, the lower Bollinger Band was broken a day or so before the EBOT trigger, which may signal an upward directional movement. Second, will also note that the DI+ has crossed the ADX. Third, the DI+ has also crossed the DI-. Fourthly, the RSI has crossed the RSI MA. Fifth, the short MACD has crossed over the long. After saying all that, did you look back on the circled part of the chart? It seems like these same patterns were repeated before, and followed with an upward movement. With all these considerations at hand, I decided to figure my risk to reward.
If there’s one thing that I like about the Profitsource software…it’s the risk to reward tool. It tends to save me a lot of time scanning through potential trades. Saying that, after looking at tons of charts, I already new that this chart would fall into the range of my risk to reward profile before applying the tool.
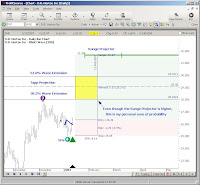
After applying the Range Projector, my initial target is 31.65. The TAPP projection is at 29.05. I also applied the wave extension tool for my 38.2% and 61.8% projections. This left me with a zone around the TAPP. The zone is marked off with the yellow square being sliced in half at 29.05, the lower part of the square at 28.04 (38.2%), and the upper limit of the square at 29.92 (61.8%). The reason why I do this, is not to ignore the Range Projectors Target, but to give me a preliminary target of possible strategy change. My risk to reward tool gave me my stop price of 25.05, an entry point of 26.34, and a timestop of Feb 12, 2007.

From here I decided to go with a straight call option. The risk to reward is 4.14 for the stock, and the May 30 Strike gives a risk to reward of 4.50. I should have compared other strikes for a greater risk to reward…but I didn’t! (Note to self: You’re an idiot). Looking at the options graph you can see the potential profit of $250.00 and the potential loss of $50.00. 250 divided by 50 gives my risk to reward of 4.50. The model price was at 0.88 with a bid/ask of 0.85/0.90 (remember you have to multiple that stuff by 100). I went with the 0.90, defined a stop at 0.45 and an exit of half the position at 1.85.

What about the Volatility? Here that view as well.
I'll wrap it up in the next post, It's almost trading time
Continued in Part 3
Fibonacci
If you like the blog, visit the forum at www.Primalgreed.com Let's Network!
PLEASE REMEMBER THIS IS FOR EDUCATIONAL PURPOSES ONLY!Labels: Elliott Wave, Part 2, Profitsource, Wave 4 Buy |
posted by Fibonacci_Trader @ 5:57 AM   |
|
| 1 Comments: |
-
Fib,
You R da Man. Yetti may be big but you are really over "The Big Man's" head here. Your teaching skills are definately showing and your knowledge demands respect from the Lower masses.
Big Man
http://pasponderings.blogspot.com
|
| |
| << Home |
| |
|
|


Fib,
You R da Man. Yetti may be big but you are really over "The Big Man's" head here. Your teaching skills are definately showing and your knowledge demands respect from the Lower masses.
Big Man
http://pasponderings.blogspot.com