| Primalgreed.com - BESTBUY, that's not what I wanted! Part 1 |
| Monday, February 5, 2007 |
PLEASE REMEMBER THIS IS FOR EDUCATIONAL PURPOSES ONLY!
Greetings all,
Well it’s time for a losing play. We can’t always win at everything…even though we want too. One lesson that took me a long time to realize is that losses is part of trading, and if you aren’t willing to take losses than you shouldn’t be trading. The psychology of trading can be a love/hate relationship; it can give you peace of mind or drive you loco. The most important part, to me, is to prepare for the losses before I place a trade. This is where a written down or charted risk/reward can give you some guidance, and keep you from make an emotional decision (well, most of the time). Let’s move on.
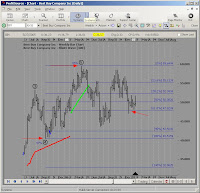
 From the Profitsource precomputed scans on 01-29-07, I came across Best Buy BBY. If your not a borderline techgeek like myself, and don’t know who BBY is, check out their profile here: http://finance.yahoo.com/q?s=bby&x=0&y=0. BBY was listed as a possible Wave 4 Sell, but it was listed as a watch indicator vs. a trigger indicator on the precomputed list. If you’re unfamiliar with the difference, you can look through your Profitsource manual, search your help manual, or view a previous post here: Previous Post For right now, here is the basic chart from 01-29 07: From the Profitsource precomputed scans on 01-29-07, I came across Best Buy BBY. If your not a borderline techgeek like myself, and don’t know who BBY is, check out their profile here: http://finance.yahoo.com/q?s=bby&x=0&y=0. BBY was listed as a possible Wave 4 Sell, but it was listed as a watch indicator vs. a trigger indicator on the precomputed list. If you’re unfamiliar with the difference, you can look through your Profitsource manual, search your help manual, or view a previous post here: Previous Post For right now, here is the basic chart from 01-29 07:
The chart seemed to pass a couple of tests at the time I placed the trade, but looking back at it, the oscillator just doesn’t seem right. Usually I like to see the oscillator moving closer to the zero line around or before the Wave 4 peak. Also, the price chart seems to be in an elongated sideways pattern between Wave 3 and 01-29-07. The TAPP shows a projected range of $45.22 by Feb 6, 07, and the Range Projector is showing a possible move to $44.85. The $44.85 level from the Range Projector has a shortest timeframe of 02-08-07, an average timeframe of 02-12-07, and the longest timeframe of 02-21-07. For those unfamiliar with the timeframe of the Range Projector, it is the vertical tick across the range projector. I will post something later with more details.

Since my 20/20 rear-view goggles are working on that oscillator, let’s look at a weekly chart from the same date. Hmm…in hindsight, the weekly chart actually looks better than the daily. It seems as if there are some Fibonacci ratios being satisfied in this chart. Lets take a look to see if anything pops up:
Taking the Fibonacci Retracement tool, we can see that the price action had dropped through the 61.8% range at the end of December, but there was also a big drop around July/August. I wonder what it’s Retracement might be. Let’s take a look at the next screenshot:
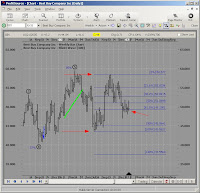
The recent low from July to the 01-29-06 seems to be confirming another direction as well. Let’s stew on that for a while, there’s a market moving somewhere!
Continued in Part 2
Later Fibonacci
If you like the blog, visit the forum at www.Primalgreed.com Let's Network!
PLEASE REMEMBER THIS IS FOR EDUCATIONAL PURPOSES ONLY!Labels: Elliott Wave, Part 1, Profitsource, Wave 4 Sell |
posted by Fibonacci_Trader @ 11:57 AM   |
|
|
|


