PLEASE REMEMBER THIS IS FOR EDUCATIONAL PURPOSES ONLY!
Continued from Part 3
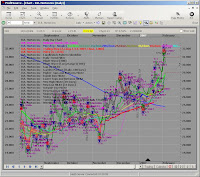
The DHI opportunity door is finally closed. The stop of $2.00 or $200.00 per contract on the remaining half of the position was met on 02-07-07. It’s interesting to note that the Trailing stop function of Profitsource had my stop placed at about $29.18 (equity price) which is around the original $29.05 TAPP. If you remember, the $29.05 TAPP was given when we first started looking at the trade. Here is a snapshot I was seeing on 02-07-07.
Is everything crystal clear now? Obviously not, but it reminds me how easy it can be to over analyze something. There are numerous tools within Profitsource, but you may only need a few of them to accomplish your purpose for a given stock or option strategy. I typically stay with a handful of indicators that I use over and over again. Of course, indicators that I use can be completely different than the ones you become comfortable with.
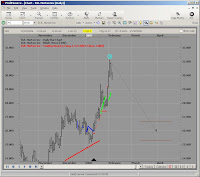
Before I pull the chart up from 02-07-07, I want you to notice something else from 02-05-07. You can notice that the Elliott Wave 5 Peak has already been met on 02-02-07, and on 02-05-07 the price action has started to move away from the peak. This by itself cannot guarantee a future direction, but as time passes, the wave count will have to correct itself one way or another.
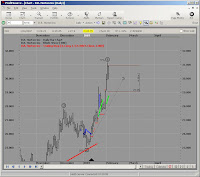
Moving forward to 02-06-07, we can see the Elliott Wave pattern has relabeled. The Elliott Wave 5 Peak has now changed to an Elliott Wave 3 Peak. The Pattern seems to leave me in a position where both the previous Wave 5 peak and the relabeled Wave 3 peak are indicating a downward directional movement.
The move downward continues on 02-07-07 where the stop was executed.
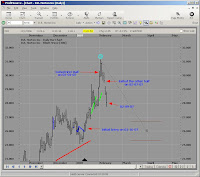
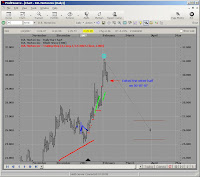
And finally, the most current chart as of 02-09-07 with the initial entry and exit points
Ok, here are the final stats for the DHI trade.
1. DHIEF MAY 30 CALL was bought at a debit of $0.95 or $95.00 per contract on 01-16-07
2. Half the position was sold at a credit of $2.40 or $240.00 per contract on 02-01-07
3. The remaining half was sold at a credit of $2.00 or $200.00 per contract on 02-07-07
4. Commission prices were $12.95 per transaction. Entry + Half exit + Other Half gives a commission total of $38.85.
5. Assuming a minimum contract amount of 2, the total debit would be $228.85 ($95.00 times 2 + $38.95 commission)
6. Assuming a minimum contract amount of 2, the total credit would be $440.00
7. Assuming a minimum contract amount of 2, your profit would be $212.00 or 92.6% ROI.
8. Assuming a minimum contract amount of 10, the total debit would be $988.85
9. Assuming a minimum contract amount of 10, the total credit would be $2200.00
10. Assuming a minimum contract amount of 10, your profit would be $1211.15 or 122.4% ROI
No matter how many contracts you traded, I can live with a double.
Later
Fibonacci
PLEASE REMEMBER THIS IS FOR EDUCATIONAL PURPOSES ONLY!
If you like the blog, visit the forum at www.Primalgreed.com Let's Network!Labels: Elliott Wave, Final Stats, Profitsource, Wave 4 Buy |


