PLEASE REMEMBER THIS IS FOR EDUCATIONAL PURPOSES ONLY!
Greetings Everyone,
I've been brushing up my spread knowledge because whatever I have to commit to posting usually requires me to do some research. With research comes understanding, and I'm all about the understanding. Hopefully everyone will add their two cents as well, I promise I won't get offended, but I do bite sometimes....lol
First of all, let me lay some credits down on the table. Most of this info has either been gathered from books, blogs, websites, seminars, and plain number crunching from the darkest area of my feeble mind. Here are some sources you might want to look up:
Credits
Web
www.CBOE.com
www.Optionetics.com
www.888options.com
www.callsandputs.com
www.optionsxpress.com
www.theoptionsguide.com
Books
The Options Course by George A. Fontanills
Options as a Strategic Investment by Larry McMillian
McMillian on Options by Larry McMillian
Option Volatility & Pricing by Sheldon Natenberg
Trade Options Online by George A. Fontanills
Options Made Easy by Guy Cohen
Risk Graph
Courtesy of Me
Bull Call Debit Spread
Learning options strategies is no different than any other form of education. If you were learning Calculus, it would be helpful to know how to add and subtract. That being said, before moving into spreads, it is necessary to understand the basics of calls and puts. For now, I'm going to move forward with the spread position, and will post something in the call and put section at a later time.
A Bull Call Debit Spread is a directional or vertical strategy that has limited risk and limited profit. Most people would consider the strategy to be less bullish than an outright call purchase, but to me, this would depend on the strike prices in relation to the underlying equity. In a Bull Call Spread, typically you will buy (long) an ATM (at-the-money) option and sell (short) and OTM (out-of-the-money) option under the same expiration period. This simultaneous buying and selling results in a Net Debit, hence a Debit Spread. It is possible to use different expiration months, but this would be considered a diagonal as opposed to a vertical spread.
For example, Let's assume the underlying equity named XXX has these properties
Current Price of XXX: $60.00
Target Price of XXX: $70.00
Stop Loss Price of XXX: $55.00
For Options on the underlying, lets assume these things:
60 Call Price: $5.00
70 Call Price: $2.50
Equity Purchase
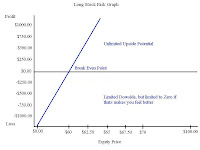 If we were to purchase a 100 shares of the underlying at $60.00 our initial debit would be $6000.00. Our Target Price gives us a potential profit of $1000.00 (($70 *100) - initial debit) and our maximum loss would be $500.00 (Initial Debit - (Stop loss of $55.00 * 100)). This gives the possibility of doubling our money or a 1:2 risk to reward. The risk graph is on the left. Since an equity could open substantially lower than the stop loss, I have posted the typical risk graph for a long stock. If we were to purchase a 100 shares of the underlying at $60.00 our initial debit would be $6000.00. Our Target Price gives us a potential profit of $1000.00 (($70 *100) - initial debit) and our maximum loss would be $500.00 (Initial Debit - (Stop loss of $55.00 * 100)). This gives the possibility of doubling our money or a 1:2 risk to reward. The risk graph is on the left. Since an equity could open substantially lower than the stop loss, I have posted the typical risk graph for a long stock.
Call Purchase
 If we were to purchase a single 60 Call, the initial debit would be $500.00. The target price of $70.00 would give us a potential profit of $1000, and if the option expired below the $60 range our maximum loss would be $500.00. In reality, the maximum loss would be considerably lower if the theoretical value of the option was calculated to the Stop loss price of the underlying. Others subscribe to the half-initial entry value position for stop losses. Using the half-initial price, your stop loss becomes half the value of what you paid for it. For example, if you bought the 60 call for $5.00, the half-initial stop loss would be $2.50. Your breakeven would be the long call strike price plus the premium or $65.00. Assuming the maximum loss of $500.00, you have the possibility of doubling our money or a 1:2 risk to reward. The risk graph is on the left. If we were to purchase a single 60 Call, the initial debit would be $500.00. The target price of $70.00 would give us a potential profit of $1000, and if the option expired below the $60 range our maximum loss would be $500.00. In reality, the maximum loss would be considerably lower if the theoretical value of the option was calculated to the Stop loss price of the underlying. Others subscribe to the half-initial entry value position for stop losses. Using the half-initial price, your stop loss becomes half the value of what you paid for it. For example, if you bought the 60 call for $5.00, the half-initial stop loss would be $2.50. Your breakeven would be the long call strike price plus the premium or $65.00. Assuming the maximum loss of $500.00, you have the possibility of doubling our money or a 1:2 risk to reward. The risk graph is on the left.
Bull Call Debit Spread Purchase
In the Bull Call Spread we will be putting on two positions, one will be long, and the other short. Both of these will be in the same expiration month. Assume we purchased the 60 call for $5.00, which would equate to a Debit of $500.00. On the short side, we would sell the 70 call for a credit of $2.50 or $250.00. This would leave us with a Net Debit of $250.00 dollars. In a Bull Call spread the Maximum loss is equal to the Net Debit (this would also include commissions)
 What about the potential profit? The profit potential of the Bull Spread is the difference in the strike prices – the Net Debit. The differences in these two strike prices are 10 (70 call-60 call). If we subtract the differences in the strike prices and then subtract the Net Debit, we are left with $7.50 or $750.00. This leaves us with a risk to reward of 1:3 or the possibility of tripling our money. If we were to purchase two spreads, the maximum risk would be $500.00 (Net Debit *2) and the Maximum profit would be $1500 (Max Profit *2). Keep in mind that increasing the number of contracts does not increase the risk to reward. Doubling the amount of contracts only doubles the dollar amount of your risk and reward. If you were to divide the 2 contract $1500 reward by the 2 contract $500 risk, the result is still 1:3 risk to reward. The breakeven point of the spread is equal to the long call + the Net Debit or $62.50. Obviously, if you subtract $70.00 (the short call) from the Breakeven of $62.50 you are left with $750.00 or the Max Profit potential. The risk graph is on the left. What about the potential profit? The profit potential of the Bull Spread is the difference in the strike prices – the Net Debit. The differences in these two strike prices are 10 (70 call-60 call). If we subtract the differences in the strike prices and then subtract the Net Debit, we are left with $7.50 or $750.00. This leaves us with a risk to reward of 1:3 or the possibility of tripling our money. If we were to purchase two spreads, the maximum risk would be $500.00 (Net Debit *2) and the Maximum profit would be $1500 (Max Profit *2). Keep in mind that increasing the number of contracts does not increase the risk to reward. Doubling the amount of contracts only doubles the dollar amount of your risk and reward. If you were to divide the 2 contract $1500 reward by the 2 contract $500 risk, the result is still 1:3 risk to reward. The breakeven point of the spread is equal to the long call + the Net Debit or $62.50. Obviously, if you subtract $70.00 (the short call) from the Breakeven of $62.50 you are left with $750.00 or the Max Profit potential. The risk graph is on the left.
Considering these three options, which strategy provides you with the best risk to reward? The underlying purchase and call purchase seem to have the same risk to reward at 1:2. One main advantage the call purchase has over the underlying is the amount of capital needed to put on the position. The call purchase requirement is only $500.00 while the underlying is $6000.00. Purchasing the call would still leave you with $5500.00 to work with.
If 2 Bull Call Spread positions were created, the risk to reward would be 1:3 as opposed to 1:2 for the underlying and call purchase. On the surface it seems that the Spread is the better bet. I would much rather have a 1:3 versus a 1:2, but what would happen if the underlying moved to the profit target in one day? Does the timeframe of the movement change some risk to rewards or strategy decisions? I think it does, but you can't be a believer until you do the research yourself. I suggest you do!
One interesting strategy noted in Options as a Strategic Investment by Larry McMillian is the use of the Bull Call Spread, a Covered Call, and the underlying to reduce the underlying break-even point. For example, suppose I originally had only an equity position of 100 shares at $60.00 a share. What if the underlying went down to $55.00? If I could go long one call and short two, I would essentially form a bull call spread and a covered call. If I bought a long call at $5.00 and shorted two calls at $2.50 my total would be $0.00 (this is not figuring commission costs). What do you think your break-even would be now? I’ll let you figure that part out...I can’t do all the work for ya.
Later,
Fibonacci 
Index for all blog postings
PLEASE REMEMBER THIS IS FOR EDUCATIONAL PURPOSES ONLY!
If you like the blog, visit the forum at www.Primalgreed.com Let's Network!Labels: Bull, Call, Debit, Spread |


