|
| Primalgreed.com - DHI my housing Dilemma Part 3 |
| Friday, February 2, 2007 |
PLEASE REMEMBER THIS IS FOR EDUCATIONAL PURPOSES ONLY!
Continued from Part 2
From my last post, several other indicators were added to the mix. These included Bollinger Bands, DMI, RSI, and MACD. The risk to reward tool in Profitsource was also used to confirm a projected target, and establish a possible entry and exit plan based upon the stock price. Finally, an option strategy was chosen, and the risk to reward of the option contract was compared to the risk to reward of the underlying equity. The options risk to reward and volatility view were done using Optionetics Platinum service.
My original entry point was at $0.90 per contract or $90.00. The defined stop was at $0.45 or $45.00, and the point of a half position profit-taking was at $1.85 or $185.00 per contract. That being said, my order was filled at $0.95 per contract.
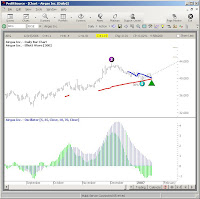
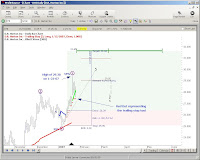 Looking back at the chart on 01-23-07 you can see that DHI made a considerable move to the upside. DHI had reached a intraday high of $29.38 and the option intraday was as high as $2.60 or $260.00 per contract. Two other things worth noting is the Elliott Wave 5 formation from the high, and the breakthrough of the $29.05 TAPP. Normally, this would be a point at which I exit the trade, but a couple of things prevented this. First, I had set my initial exit for profit-taking higher than the $2.60 of the intraday. Secondly, greed had set-in by the time I saw the contract price reach $2.60, because I still believed DHI had a considerable move to come, so I moved the stop-loss point up to the trailing stop point of around $27.41, and left the profit-taking exit the same. If you haven’t used the trailing stop function in Profitsource, I would suggest you give it a try and see if it works for you. The only gripe I have is that you can’t pick a entry date from a mouse click. This forces you to enter the date in manually. Looking back at the chart on 01-23-07 you can see that DHI made a considerable move to the upside. DHI had reached a intraday high of $29.38 and the option intraday was as high as $2.60 or $260.00 per contract. Two other things worth noting is the Elliott Wave 5 formation from the high, and the breakthrough of the $29.05 TAPP. Normally, this would be a point at which I exit the trade, but a couple of things prevented this. First, I had set my initial exit for profit-taking higher than the $2.60 of the intraday. Secondly, greed had set-in by the time I saw the contract price reach $2.60, because I still believed DHI had a considerable move to come, so I moved the stop-loss point up to the trailing stop point of around $27.41, and left the profit-taking exit the same. If you haven’t used the trailing stop function in Profitsource, I would suggest you give it a try and see if it works for you. The only gripe I have is that you can’t pick a entry date from a mouse click. This forces you to enter the date in manually.
Just a side note: After realizing my undisciplined habit of greed, I immediately started watching one of my favorite recorded episodes of Deal or No Deal. I keep this around for just such an occasion. It reminds me of how easy it is to make a winning, sure-thing trade, into a big loser. Fortunately, this time, I was saved from my own stupidity even though the markets are not generous to the hard-headed.

On 02-01-07, I exited half the position for a credit of $2.40 or $240.00 per contract, and will the let the rest of it ride as long as it doesn’t go much below the $2.00 or $200.00 range or becomes to close to expiration. At this point, the initial investment has doubled, and the open-half is essentially a free trade. As you can see, the Wave 5 formation has moved up as well.
Continued in Final Stats
I will give the final stats later.
Later, Fibonacci
If you like the blog, visit the forum at www.Primalgreed.com Let's Network!
PLEASE REMEMBER THIS IS FOR EDUCATIONAL PURPOSES ONLY!Labels: Elliott Wave, Part 3, Profitsource, Wave 4 Buy |
posted by Fibonacci_Trader @ 8:44 AM Add to: DiggIt! | Del.icio.us | blink it |   |
|
|
|
| Primalgreed.com - DHI my housing Dilemma Part 2 |
| Monday, January 29, 2007 |
PLEASE REMEMBER THIS IS FOR EDUCATIONAL PURPOSES ONLY!
Continued from Part 1
Greetings all,
From the previous post, using ProfitSource, I first came across DHI on 1/12/07. The company’s profile is listed here: http://finance.yahoo.com/q/pr?s=DHI

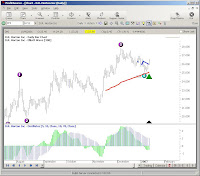
When we last left, I was confirming the retracement levels using both the retracement tool and the wave extension tool. I hope you have tried out both, they have different advantages and disadvantages. I also like to look at several other indicators to get a better feel of “The Picture” we talked about before. From the screen shot, you can see I have included Bollinger Bands, DMI, RSI, and MACD.
First, the lower Bollinger Band was broken a day or so before the EBOT trigger, which may signal an upward directional movement. Second, will also note that the DI+ has crossed the ADX. Third, the DI+ has also crossed the DI-. Fourthly, the RSI has crossed the RSI MA. Fifth, the short MACD has crossed over the long. After saying all that, did you look back on the circled part of the chart? It seems like these same patterns were repeated before, and followed with an upward movement. With all these considerations at hand, I decided to figure my risk to reward.
If there’s one thing that I like about the Profitsource software…it’s the risk to reward tool. It tends to save me a lot of time scanning through potential trades. Saying that, after looking at tons of charts, I already new that this chart would fall into the range of my risk to reward profile before applying the tool.
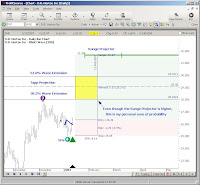
After applying the Range Projector, my initial target is 31.65. The TAPP projection is at 29.05. I also applied the wave extension tool for my 38.2% and 61.8% projections. This left me with a zone around the TAPP. The zone is marked off with the yellow square being sliced in half at 29.05, the lower part of the square at 28.04 (38.2%), and the upper limit of the square at 29.92 (61.8%). The reason why I do this, is not to ignore the Range Projectors Target, but to give me a preliminary target of possible strategy change. My risk to reward tool gave me my stop price of 25.05, an entry point of 26.34, and a timestop of Feb 12, 2007.

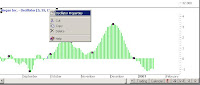
From here I decided to go with a straight call option. The risk to reward is 4.14 for the stock, and the May 30 Strike gives a risk to reward of 4.50. I should have compared other strikes for a greater risk to reward…but I didn’t! (Note to self: You’re an idiot). Looking at the options graph you can see the potential profit of $250.00 and the potential loss of $50.00. 250 divided by 50 gives my risk to reward of 4.50. The model price was at 0.88 with a bid/ask of 0.85/0.90 (remember you have to multiple that stuff by 100). I went with the 0.90, defined a stop at 0.45 and an exit of half the position at 1.85.

What about the Volatility? Here that view as well.
I'll wrap it up in the next post, It's almost trading time
Continued in Part 3
Fibonacci
If you like the blog, visit the forum at www.Primalgreed.com Let's Network!
PLEASE REMEMBER THIS IS FOR EDUCATIONAL PURPOSES ONLY!Labels: Elliott Wave, Part 2, Profitsource, Wave 4 Buy |
| posted by Fibonacci_Trader @ 5:57 AM Add to: DiggIt! | Del.icio.us | blink it | |
|
|
|
| Primalgreed.com - DHI my housing Dilemma |
| Sunday, January 28, 2007 |
PLEASE REMEMBER THIS IS FOR EDUCATIONAL PURPOSES ONLY!
Greetings all,
Using ProfitSource, I first came across DHI on 1/12/07. For those of your unfamiliar with the company, DR Horton is a homebuilding/financing company listed on the NYSE. For a company profile you can look here:
http://finance.yahoo.com/q/pr?s=DHI
What is interesting to me, is that the media has been bombarding our senses with the doom and gloom of the real estate market for quite awhile. I've always been a "against the masses" type of guy, but I've also made the mistake of being "against the general market". Here lies the dilemma. Do I really think the housing market is all doom and gloom, or do I think the big boys are looking at opportunity. For now, here's the chart I saw on 01/12/07:
 For me, I don't feel frisky about pulling up a precomputed scan, selecting a risk to reward ratio that's acceptable and then placing the trade. I think their are several questions that need to be asked before moving forward. For me, I don't feel frisky about pulling up a precomputed scan, selecting a risk to reward ratio that's acceptable and then placing the trade. I think their are several questions that need to be asked before moving forward.
1. I know that Profitsouce will pull up these scans by criteria already set, but I still like to confirm these criteria by hand. At the very least, it allows you to become more familiar with the software tools.
2. Before I go through all that business, "THE PICTURE" still has to be right (i would say feel right, but that has got me in trouble before). In my experience, the closer the chart looks like a true Elliott wave pattern, the closer it seems to be in reality. All those charts with huge swings, gaps up and down, etc have their place, but that volatility thing can make or break ya. There's nothing worse than seeing a trade that goes in the intended direction, but the option's price is stagnant or decreases. Being primarily an option trader Volatility has become my best friend and my worst enemy. And since I'm looking at this from the biased eyes of an option's trader, I still have to pull up a risk graph from another source to see if it's Picture is inline with my overall strategy.
3. What is the long term picture looking like. It's great to take a snapshot of few weeks of data, but where has the price been before. This is always important to analyze points of support and resistance. It also lets you get an idea of how big a swing will effect the price based on past events, earnings, news, upgrades, downgrades, etc. The first chart was a daily graph from a small time frame and the next chart is the weekly view over several years.
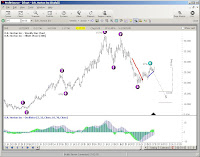
Notice how the wave patterns for the long-term and short term are strikingly different.

4. Wow, did you notice the TAPP's. The first screen shot cut it off, but its 29.05 by March 14,2007. The weekly chart has a TAPP of 16.03 by August 10,2007. Well which way is it going to go, thats a range of 13.02. Maybe none, maybe both. I do know that once you start applying the range projector tool, the tool itself will have no directional bias in its forecasting. Don't take my word for it, check out the Profitsouce tutorials and they will say the same thing. So if we go back to the original daily chart we can have two possible targets to view. Look to the left:

5. Overlaying the 21, 50, and 200 SMA, you can see several different results. I would classify myself as a short to mid-term trader so the 21 day SMA works fine for me. This allows me to get a feel of the short term movement over the last 3 weeks. The 50/200 SMA is one I almost always use primarily because everyone else does. Sometimes, it feels as though the 50/200 SMA becomes a self-fulfilling prophecy... at least in the short-term. Whether it truly predicts the price movement in the long-term is less important to me than whether the majority of investors BELIEVE it predicts the price movement. If the antelope herd is being chased up hill by a lion, so be it...even if the lion turns out to be a....monkey..no...a giraffe...no...probably another ANTELOPE. You can also see that the EBOT has been satisfied. Here's the view:
6. I had mentioned earlier about confirmation of the EW pattern early. Next we will confirm that the that the ratios look right. Just a side note: I always like to perform a custom Data on Demand of a least 5 years to make sure my data doesn't have any holes in it. Well, how much should Wave 4 Pull back, and what tool can I use. For the EW4B Pattern, the range is usually between 24-62%. I use two different tools to perform the confirmation and you can use either one. The first one is the Fibonacci Retracement tool and the second is the Wave extension tool. The first screen shot includes the tools, the other two represent the final display of the two tools, and how they look a little different.

Fibonacci Retracement Tool and Wave Extension Tool in the Drawing tools Menu

Application of Fibonacci Retracement Tool on Price Chart

Application of Wave Extension Tool on Price Chart
Check back with me later....I'm not finished yet
Continued in Part 2
By the way, the STZ trade posted earlier was a losing trade and I'll finish it up too
Later, Fibonacci
If you like the blog, visit the forum at www.primalgreed.com Let's Network!
PLEASE REMEMBER THIS IS FOR EDUCATIONAL PURPOSES ONLY!Labels: Elliott Wave, Part 1, Profitsource, Wave 4 Buy |
| posted by Fibonacci_Trader @ 1:53 PM Add to: DiggIt! | Del.icio.us | blink it | |
|
|
|
| Profitsource - Elliott Oscillator Overlays |
|
PLEASE REMEMBER THIS IS FOR EDUCATIONAL PURPOSES ONLY!
Hello Everyone,
I want to share with everyone a different look for the Elliott Oscillator Indicator in Profitsouce. For those of you that already have this figured out...YOU DA MAN! I don't know about everyone else, but I'm a big histogram user when it comes to the oscillator. The only problem I had is that I wanted one histogram range to overlap another histogram range, and still be able to see both of them.
Sure you can make one data range a histogram and another a line, but that just said boring to me. Here's a picture of what I'm talking about:
1. Right Click on the Oscillator Title or on the Oscillator itself and select oscillator properties
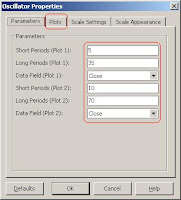
2. Then Properties Box will pull up. Here you can set the properties for the 1st and 2nd Oscillators. Plot 1 is for oscillator 1 and Plot 2 is for second oscillator. You can also config the data field for open, close, etc. When your finished, click on the plots tab of the oscillator properties box.
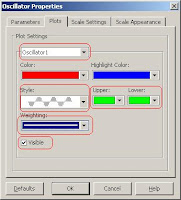
3. Now you should be in the plots tab of the properties box. Select Oscillator 1, Select the Style as Histogram, Select the upper and lower colors (I leave these the same color), Select the Weighting as the second selection down (right after the smallest line), and check the visibility box. Don't worry about the Color and Highlight color fields.
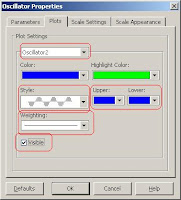
4. Stay in the same box and select the oscillator 2, select the histogram style, select the upper and lower colors, Select the weighting as the smallest line or first selection, and check visibility.
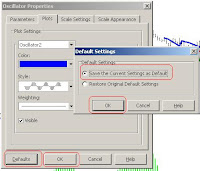
5. If you want to keep these as your defaults then select Defaults, Select "Save as Default Settings", Select OK, and the select OK to the oscillator properties box.
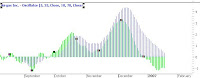
6. And here we are with the net result
You will have to experiment with different line weightings and colors to get your perfect preference, but I hope this helps....it was racking my brain for a while.
Happy Trading,
Fibonacci 
If you like the blog, visit the forum at www.primalgreed.com Let's Network!
PLEASE REMEMBER THIS IS FOR EDUCATIONAL PURPOSES ONLY!Labels: Elliott Wave, Oscillator, Profitsource |
| posted by Fibonacci_Trader @ 12:33 PM Add to: DiggIt! | Del.icio.us | blink it | |
|
|
|
| BT Music Video and Fibonacci |
|
PLEASE REMEMBER THIS IS FOR EDUCATIONAL PURPOSES ONLY!
Some entertainment for you profitsource users that use all things Fibonacci,
It never ceases to amaze me the correlation between Fibonacci numbers and nature. If you head over to http://stage6.divx.com/BT/show_video/1051714 you can see and hear music / visuals based on these numbers.
The Video is about 11 minutes long. It starts out slow, but stick around for a while and enjoy.
BT is the artist, 1.618 is the tracks name (hmmm...that rings a bell), and the album is called "This Binary Universe". You can also check out the artists home page at http://www.thisbinaryuniverse.com/
Later, Fibonacci
If you like the blog, visit the forum at www.primalgreed.com Let's Network!
PLEASE REMEMBER THIS IS FOR EDUCATIONAL PURPOSES ONLY!Labels: Entertainment, Fibonacci, Misc |
| posted by Fibonacci_Trader @ 8:50 AM Add to: DiggIt! | Del.icio.us | blink it | |
|
|
|
| 401k - Ignorance in the Masses and the 80% |
|
PLEASE REMEMBER THIS IS FOR EDUCATIONAL PURPOSES ONLY!
I'm not an investment guru by any means. But I would feel confident in saying that I probably know more about the market than 80% of my peers. In saying that, I recently have been bombarded with questions by the 80% about their personal 401k's. Some of the questions that are usually posed are:
1. What is a 401k?
2. What should I put my money in?
3. How much should I contribute?
4. What is the S&P
5. What do you think about "X" fund?
6. How do you logon to your 401k provider?
7. Once you logon, how do you change from one fund to another?
8. Who is Morningstar?
9. What is a Dividend?
10. Why are they charging me for this fund...its my money?
The list can go on and on. The sad part about it, is that the majority of the 80% have been uninformed, misinformed, or plain lazy about their 401k plans for more than 5 years. Somehow, the 80% have been convinced that their 401k is a pension plan and the market has no effect on there retirement portfolio.
It always amazes me that the 80% put more time in selecting the right refrigerator that they do their fund selections. The 80% can tell you their refrigerator was made in China, but can't tell you what country their fund invests in. The 80% can rattle off the features of different refrigerators, but can't tell you whether their funds are invested in technology, energy, or the bond market. The 80% will hire a termite inspector, appraiser, and home inspector before they plunk down $100,000 on a home, but take the "dart throwing" technique of selecting a fund with their $100,000 vested balance. How can this be! To say the least, it has me confused.
Personally, I think the 80% make their fund selection based upon two things:
1. The previous years performance
2. The "Neato" name of the fund.
Example:
"What about T. Rowe Price Science and Technology?" "Technology is the the wave of the future." "The future is going towards technology" "Look at Bill Gates, he's in technology." "I think I can make a lot of money in technology" "The performance was good last year, its gonna be great this year" "Besides, I have to retire in 5 years".
Well everything was fine until about the middle of April 2006 when PRSCX stepped on a banana peel. Take a look at:
http://finance.yahoo.com/charts#chart4:symbol=prscx;range=2y;indicator=volume;charttype=line;crosshair=on;logscale=on;source=undefined
What about that whole contribution thing? Well, if the company matches 50% up to 6% of of your income...WHAT ARE YOUR WAITING ON...WHAT IS YOUR PROBLEM! That's a 50% return on every dollar you put in. Even if you lose 10% in your fund, are you not still making 40%. This all seems like a no-brainer to me, but many of the 80% rather put their extra money in a savings plan that may lose .5% after factoring in yearly inflation.
I'm not advocating a day-traders strategy to your 401k, besides those turn-around "nasty grams" from your 401k provider will keep you from doing that. What I am saying is try putting as much effort in selecting your funds, as you do the color of your Ipod. Unfortunately, most of the 80% don't even do that.
Later,
Fibonacci
If you like the blog, visit the forum at
http://www.primalgreed.com Let's Network!
PLEASE REMEMBER THIS IS FOR EDUCATIONAL PURPOSES ONLY!Labels: 401k, Ignorance |
| posted by Fibonacci_Trader @ 8:35 AM Add to: DiggIt! | Del.icio.us | blink it | |
|
|
|
|
|


