PLEASE REMEMBER THIS IS FOR EDUCATIONAL PURPOSES ONLY!
Continued from Part 1
Greetings, I hope recent market downturn hasn't discouraged you.
Previously, we had dived into Profitsource trying to discover the Bollinger Band Tool. From earlier, we discovered that Bollinger Bands had early origins in Trading bands. Trading bands form off a centerline, which is a configurable moving average. The Outer bands from Trading bands can be adjusted by a given percentage, up or down, from the moving average. Now we move on to Bollinger Bands
Earlier, we had discovered that Bollinger Bands are based upon Standard Deviation, and I'm sure many stopped and said "OH NO!" Not to worry, I had to do a little refresher research myself.
Sidenote: If you are currently using Bollinger Bands for trading signals, confirmation, etc, and don't already have a decent grasp on most of this...SHAME ON YOU!
 Q: Well, what is standard deviation? Q: Well, what is standard deviation?
A: Standard deviation is based upon the average or mean of a data group. The standard deviation itself expresses a clustering or grouping density around the mean. This is visually represented in a bell graph. A bell graph is to the left, Courtesy of Wikipedia. The dark blue represents One Standard Deviation from the mean. The lighter blue represents Two Standard Deviations from the mean, and the lighest blue indicates Three Standard deviations. For example, my data sample could include the total amount of cookies baked in 2006, and how many chocolate chips are in each of them. The centerline drawn down through the peak of the graph could represent the average amount of chocolate chips per cookie over the entire data group. The dark blue would indicate that 68.26894921371% of my cookies have a One Standard Deviation amount of chips from the mean. The lighter blue would indicate that 95.44997361036% of my cookies have a Two Standard Deviation amount of chips from the mean. Keep in mind that Two Standard deviations is the first deviation plus the second deviation. I could keep going on, but I'm starting to get hungry...munch...munch.

Now that I finished brushing the crumbs off the keyboard, can you see how this would apply to equity price movement? If I'm going to use Bollinger Bands, I probably need to get an idea of the size of my data group size and I also need to determine how many Standard Deviations I want to include for my given sample size. Looking at Profitsource's Bollinger Band Tool Properties, I see that both of these fields are available for me. The periods would be my Data Group, and the Standard Deviations would be the amount of Standard Deviations I want to apply to the Data Group.
Here is a list of the percentage of data from the data group that will fall under various standard deviations.
One Standard Deviation 68.26894921371%
Two Standard Deviations 95.44997361036%
Three Standard Deviations 99.73002039367%
Four Standard Deviations 99.99366575163%
Five Standard Deviations 99.99994266969%
Six Standard Deviations 99.99999980268%
Seven Standard Deviations 99.99999999974%
Deviation Percentages courtesty of Wikipedia
Before you start getting all excited, remember that the accuracy of these percentages depends on the size of the Data Group. Let me show you a couple charts from Profitsource to make things a little clearer.

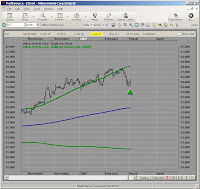
Here is a chart with the data group being set to Profitsource's default. The default setting is 20 periods (data group), and 2 standard deviations. Notice how the majority of the price movement is included, but not all. Two standard deviations should include 95.44997361036%, but this doesn't look to be the case. If the periods or data group was larger, these percentages might fall into place. Lets changes some parameters and see what happens.

Here is the same chart, but with the amount of standard deviations changed to 4 instead of 2. Now, even though our sample is small, all the data is encompassed by the Bollinger bands. What if we had left the Standard Deviations at 2 and just increased the data group? Let's try that one as well, but I'm sure it will not be the result most people expect.
Wow, what happened here? The standard deviations was set to 2 and the periods where changed to 200 versus 20. You would think that increasing the data group or periods size would make the Bollinger Bands all encompassing. If we keep in mind that the standard deviation is a measurement from the mean, maybe things will become more clearer. Remember that a recent large price movement or trend can skew the graph. Let's back the chart up a little
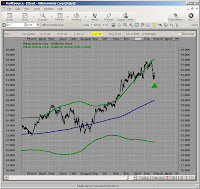
You can see now that there has been some serious movement over the last 200 days. Most of the movement seems to be hugging the upper band, but there was a lot of movement below the band as well. So is the data group or period encompassing 95.44997361036% of the price? Not exactly, but the larger the sample, the closer the percentages.
Don't take my work for it though, try some of this stuff yourself and see what you come up with. I have more to come, but if your like me, you have to digest this slowly....where are those cookies?
To be Continued in Part 3
Later Fibonacci
PLEASE REMEMBER THIS IS FOR EDUCATIONAL PURPOSES ONLY!
If you like the blog, visit the forum at www.Primalgreed.com Let's Network!Labels: Bollinger Bands, Part 2, Profitsource, Standard Deviation |


