|
| Highest High and Lowest Low Tool in Profitsource |
| Saturday, February 17, 2007 |
PLEASE REMEMBER THIS IS FOR EDUCATIONAL PURPOSES ONLY!
Greetings,
This is an example of the application of the HH (Highest High) and LL (Lowest Low) tool within Profitsource. If your not looking for a moving average of price movement and simple want to see the high or low over a given period of time, this may be the tool for you. My personal setting range from mid-term to long periods, but you can configure the period however you want. Here's the example:
Later,
Fibonacci
PLEASE REMEMBER THIS IS FOR EDUCATIONAL PURPOSES ONLY!
If you like the blog, visit the forum at www.Primalgreed.com Let's Network!Labels: HH, High, Highest, LL, Low, Lowest, Profitsource |
posted by Fibonacci_Trader @ 9:15 AM Add to: DiggIt! | Del.icio.us | blink it |   |
|
|
|
| Trading / Calendar days setting revisited in Profitsource |
|
PLEASE REMEMBER THIS IS FOR EDUCATIONAL PURPOSES ONLY!
Greetings,
Further Clarification of Trading vs. Calendar days from the main chart in Profitsource. I had went the long way around in adjusting the chart properties. This is a bit easier, but the last example from the Time Analysis Tool Post is still helpful if you want to save as defaults to the charts. There are also some additional tips about the configuration in the chart properties screen in Profitsource. Check it out.
Later,
Fibonacci
PLEASE REMEMBER THIS IS FOR EDUCATIONAL PURPOSES ONLY!
If you like the blog, visit the forum at www.Primalgreed.com Let's Network!Labels: Calendar, Profitsource |
| posted by Fibonacci_Trader @ 8:46 AM Add to: DiggIt! | Del.icio.us | blink it | |
|
|
|
| Time Analysis Tool in Profitsource |
| Friday, February 16, 2007 |
PLEASE REMEMBER THIS IS FOR EDUCATIONAL PURPOSES ONLY!
Greetings,
Sometimes it may be necessary to outline a consistent timeframe pattern to spot weekly, monthly, yearly, etc trends in price movement. The Time Analysis tool gives you this handy feature. The downside to the tool is the manual configuration of the initial timeframe, but other than that...it can be very handy. Below is a small review of the interim tool followed by an example of a time analysis application.
Later,
Fibonacci
PLEASE REMEMBER THIS IS FOR EDUCATIONAL PURPOSES ONLY!
If you like the blog, visit the forum at www.Primalgreed.com Let's Network!Labels: Analysis, Profitsource, Timeframe |
| posted by Fibonacci_Trader @ 7:04 AM Add to: DiggIt! | Del.icio.us | blink it | |
|
|
|
| Using the Interim Time Frame Tool in Profitsource |
| Thursday, February 15, 2007 |
PLEASE REMEMBER THIS IS FOR EDUCATIONAL PURPOSES ONLY!
Greetings Everyone,
One important consideration for any price movement is timeframe. While it feels great to apply a range projection, look at the TAPP (T- Target, A-And, P-Price, P-Projection), and say “this should move to $XX.XX by such and such date”, sometimes it may be useful to analyze the time frames of previous movements. There are several tools you can use for timeframe analysis in Profitsource, but maybe we should start with one of the most simplistic, the Interim Time Frame Tool.
There are two ways to get to the Interim Time Frame Tool, and this applies to Drawling tools in general. One way is to make sure your page monitor sidebar is open on the right-hand side of the screen. If you don’t see the page monitor sidebar, select view from the Profitsource menu and then select page monitor. Next, select Drawing tools from the drop down arrow, and the Interim Time Frame Tool is located there. Here is a short clip:
The second way to access the Interim Time Frame Tool is by directly clicking on the Drawing Icon located on the top of the Profitsource main screen. A small toolbar window should pop-up and you can then select the Gann tab where the Interim Time Frame Tool is located. Here is another clip
After you select the Interim Time Frame Tool you will have to select the timeframe you want to measure. This requires you to select two individual points with a left mouse click. For example, you may want to determine the amount of calendar days or trading days between a recent point of support and a new point of resistance, or simply any timeframe that appears to strike you as interesting. After selecting the Interim Time Frame tool, left-click on your first point, and then left-click on your second point. After you select the first point, you will notice a triangle being drawn, the base of your triangle will be the length of the timeframe after your click on your second target point. The angle of the tool doesn’t matter. In the following example, my second target point was placed on the high of the day, but it can be placed anywhere as long as the date is the same. Here’s an example:
You now have a floating time tool based upon a previous time frame that can be placed anywhere within the chart. To place the timeframe on the chart, simply left-click where you want it, and there you go. After your done, you can move the complete time frame tool (what is now the diagonal and straight line) by a left click on the diagonal to select it, left-clicking again and holding, and then drop it to your location, or simply move the comparable time frame (straight line) by doing the same procedure. Here’s an example
One additional thing you can do is manually adjust the properties of the Interim Time Frame Tool, by right clicking on the diagonal or straight line, and selecting the Interim Time Frame Properties. The First date is your initial point or first click. The second date is the end point or second click. The third date is the point that the horizontal line begins. The forecast date is grayed out, but is simply the end of the horizontal line. You can also configure trading days or calendar days, and by proceeding to the appearance tab, change the color, style and line width. Here’s an example:
This is just one of several tools for timeframe analysis, and I hope it was helpful. I’m going to try to post a different tool once a week.
Later
Fibonacci
PLEASE REMEMBER THIS IS FOR EDUCATIONAL PURPOSES ONLY!
If you like the blog, visit the forum at www.Primalgreed.com Let's Network!Labels: Interim, Profitsource, Tool |
| posted by Fibonacci_Trader @ 9:16 AM Add to: DiggIt! | Del.icio.us | blink it | |
|
|
|
| Adding Favorites in Profitsource |
| Tuesday, February 13, 2007 |
PLEASE REMEMBER THIS IS FOR EDUCATIONAL PURPOSES ONLY!
Testing some flash and voice over. My voice may be annoying so....cover your ears. This is just meant to be a simple test to see if the resolution and voice can be done.
I promise it will improve, just let me know what you think!
Later
Fibonacci
PLEASE REMEMBER THIS IS FOR EDUCATIONAL PURPOSES ONLY!
If you like the blog, visit the forum at www.Primalgreed.com Let's Network!Labels: Favorites, Profitsource |
| posted by Fibonacci_Trader @ 12:17 AM Add to: DiggIt! | Del.icio.us | blink it | |
|
|
|
| Primalgreed.com – DHI my housing Dilemma – Final Stats |
| Monday, February 12, 2007 |
PLEASE REMEMBER THIS IS FOR EDUCATIONAL PURPOSES ONLY!
Continued from Part 3
The DHI opportunity door is finally closed. The stop of $2.00 or $200.00 per contract on the remaining half of the position was met on 02-07-07. It’s interesting to note that the Trailing stop function of Profitsource had my stop placed at about $29.18 (equity price) which is around the original $29.05 TAPP. If you remember, the $29.05 TAPP was given when we first started looking at the trade. Here is a snapshot I was seeing on 02-07-07.
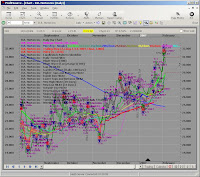
Is everything crystal clear now? Obviously not, but it reminds me how easy it can be to over analyze something. There are numerous tools within Profitsource, but you may only need a few of them to accomplish your purpose for a given stock or option strategy. I typically stay with a handful of indicators that I use over and over again. Of course, indicators that I use can be completely different than the ones you become comfortable with.
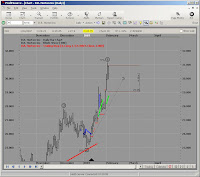
Before I pull the chart up from 02-07-07, I want you to notice something else from 02-05-07. You can notice that the Elliott Wave 5 Peak has already been met on 02-02-07, and on 02-05-07 the price action has started to move away from the peak. This by itself cannot guarantee a future direction, but as time passes, the wave count will have to correct itself one way or another.
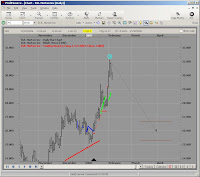
Moving forward to 02-06-07, we can see the Elliott Wave pattern has relabeled. The Elliott Wave 5 Peak has now changed to an Elliott Wave 3 Peak. The Pattern seems to leave me in a position where both the previous Wave 5 peak and the relabeled Wave 3 peak are indicating a downward directional movement.
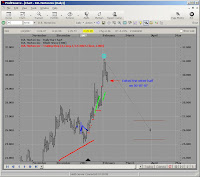
The move downward continues on 02-07-07 where the stop was executed.
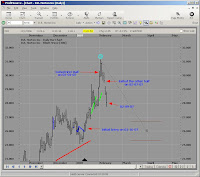
And finally, the most current chart as of 02-09-07 with the initial entry and exit points
Ok, here are the final stats for the DHI trade.
1. DHIEF MAY 30 CALL was bought at a debit of $0.95 or $95.00 per contract on 01-16-07
2. Half the position was sold at a credit of $2.40 or $240.00 per contract on 02-01-07
3. The remaining half was sold at a credit of $2.00 or $200.00 per contract on 02-07-07
4. Commission prices were $12.95 per transaction. Entry + Half exit + Other Half gives a commission total of $38.85.
5. Assuming a minimum contract amount of 2, the total debit would be $228.85 ($95.00 times 2 + $38.95 commission)
6. Assuming a minimum contract amount of 2, the total credit would be $440.00
7. Assuming a minimum contract amount of 2, your profit would be $212.00 or 92.6% ROI.
8. Assuming a minimum contract amount of 10, the total debit would be $988.85
9. Assuming a minimum contract amount of 10, the total credit would be $2200.00
10. Assuming a minimum contract amount of 10, your profit would be $1211.15 or 122.4% ROI
No matter how many contracts you traded, I can live with a double.
Later
Fibonacci
PLEASE REMEMBER THIS IS FOR EDUCATIONAL PURPOSES ONLY!
If you like the blog, visit the forum at www.Primalgreed.com Let's Network!Labels: Elliott Wave, Final Stats, Profitsource, Wave 4 Buy |
| posted by Fibonacci_Trader @ 12:18 PM Add to: DiggIt! | Del.icio.us | blink it | |
|
|
|
|
|


